
You Sure About That?
Using Davenport’s Projections To Test Our Fantasy Baseball Expectations; SOTW gives a nod to “Ohio” and the distant yet familiar sound of Gabriels

FanGraphs is such a key resource for fantasy baseball nerds, not least due to the fulsome set of public projections hosted on the site. Navigate to a player page and voila, you have five original projection sets plus three variants based on assorted playing time estimates. A common way to leverage projections—which aren’t precise predictions by definition—is to aggregate some or all of the original systems.
One simple method to do this is by averaging the systems one wishes to use; frankly not so simple if one isn’t a spreadsheet wizard. Thankfully members of the Bubba & The Bloom Patreon get access to sheets that do this for you! I’d subscribe for this tool alone, I mean even a Luddite could appreciate this data art:
Those aggregated numbers comprise a blend of The Bat, The Bat X, OOPSY, and FG Depth Charts (itself a combination of Steamer and ZiPS). We’ll refer to these aggregated projections as “FG Composite.”
One could also simply rely on ATC, which itself uses weighted averages of other, original systems.
Here’s the thing: there tends to be a fair amount of agreement between the various FG systems, which is to be expected given their shared project of regressing past performance to a mean using best practices. This phenomenon is further accelerated by mooshing them all together.
Hence the point of this post, finally. Clay Davenport is one of the OG sabermetricians in the baseball space. He co-founded Baseball Prospectus in 1996, providing data support and projections work there until he went independent in 2011. Since then, he has produced his own set of comprehensive player and team projections, including standings, all of which can be found here: https://claydavenport.com/projections/PROJHOME.shtml
We noticed a few significant differences between Davenport’s player projections and those available on FanGraphs. Some of this may be process-based, as we don’t believe Davenport inputs Statcast data while at least two of FG’s do. In addition, he creates his own playing time estimates, a distinction diminished among FG’s as multiple of those systems crib off Roster Resource for their PT.
Okay, now to the fun part. I reviewed Davenport’s projections for players that differ most from their FG Composite numbers. First we’ll examine hitters Davenport (“CD”) is lower on, then we’ll compare where he’s higher, before repeating the process for starting pitchers.
Hitters — Davenport Lower
Ben Rice (49 ADP)
CD: 23/6/.237* (510 AB)
FG Composite: 25/5/.247 (465 AB)
*Rice did have a ridiculous .186 BABIP as a rookie and his actual average has been 30-60 points below his Statcast xBA. Those cut in opposite directions but this is a reminder that there may be more BA downside than we expect from the hottest helium name in drafts (now the clear C2).
—
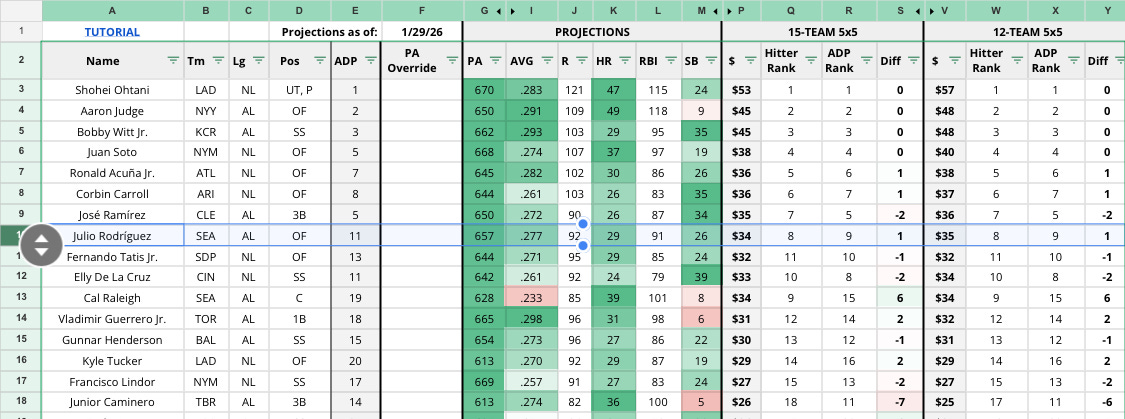
Julio Rodriguez (12 ADP)
CD: 24/28/.249 (602 AB)
FG Composite: 29/26/.271 (610 AB)
Striking potential downside call here. The worst FG projection for Julio is ZiPS (29/27/.266). Raised an eyebrow but I’m leaning to the FG composite.
—
Seiya Suzuki (103 ADP)
CD: 20*/6/.249 (537 AB)
FG Composite: 26/9/.254 (540 AB)
*Reminder Seiya’s 32 dongs last season was a departure; he hit 20 and 21 the prior two years (in ~60 fewer ABs, but scale the PT up and it’s more like 23 HR). But he hit for a higher average then, which Davenport is also not giving him. My drafting habits (three Suzuki shares) indicate I must skip blissfully past CD’s numbers here, but you don’t have to.
—
Wyatt Langford (52 ADP)
CD: 20/20/.243 (539 AB)
FG Composite: 24/20/.253 (530 AB)
Langford hit 38 combined homers over ‘24-25, although that includes a 10% HR/FB% in ‘24 (it’s been 15% or higher at all other stops). Every projection pours cold water on him being a BA asset.
HITTERS — Davenport Warmer
I don’t believe Davenport incorporates Statcast data into his projections, which might explain some positive outliers in his system compared to the FG composite, where we know The Bat X and OOPSY do include data points like Barrels, exit velocities, et cetera.
As a result, Davenport’s numbers pop for high quantity, low quality contact kings like…
Jacob Wilson (177 ADP)
CD: 16/9/.296 (572 AB)
FG Composite: 10/5/.298 (520 AB)
Pretty huge power and speed spreads here. Having seen a lot of A’s games in that silly park, I’ll take the over on 10 dingers. He’s a major value if you buy CD’s numbers.
—
Ezequiel Tovar (193 ADP)
CD: 22/8/.270 (605 AB)
FG Composite: 20/10/.263 (595 AB)
Already a value even with the aggregate projections, CD sees even more Tovar upside. Remember he dealt with injuries last season and leads off playing in Coors half the time.
—
Ernie Clement (285 ADP)
CD: 14/13/.268 (573 AB)
FG Composite: 10/9/.260 (535 AB)
CD’s more well-rounded line boosts ErnDog’s appeal, but there may be a PT crunch in Toronto that keeps me away at cost, even with his 3B/2B/SS/everywhere eligibility.
PITCHERS — Davenport Downers
One global observation: the FanGraphs systems are more sanguine generally regarding innings pitched. It’s probably wise to round down on workloads for this most injury-prone player group.
Also: Davenport says youth shall NOT be served in 2026.
Chase Burns (110 ADP)
CD: 4.46 ERA, 1.26 WHIP, 148 K (113 IP)
FG Composite: 3.56 ERA, 1.16 WHIP, 159 K (131 IP)
That’s sobering, eh? Davenport grants Burns’ absurd punchout powers, but expects serious damage to ensue; compare CD ratios to the worst FG projection, from Steamer: 3.74 ERA, 1.20 WHIP, 150 K (132 IP).
—
Bubba Chandler (149 ADP)
CD: 4.36 ERA, 1.31 WHIP, 127 K (131.3 IP)
FG Composite: 4.06 ERA, 1.31 WHIP, 149 K (156 IP)
And you thought Derek Carty hates the youths. But it’s actually Steamer again—with 4.30/1.36 ratios—that best matches Davenport’s Bubba skepticism (on an arsenal analysis level, Chandler does need to develop a more effective breaker to righties).
—
Andrew Painter (360 ADP)
CD: 5.07 ERA, 1.46 WHIP, 89 K (103.7 IP)
FG Composite: 4.13 ERA, 1.28 WHIP, 113 K (128 IP)
The former top pitching prospect didn’t replicate that level while returning from TJ surgery last season. It’s a late enough pick that we’re okay taking a few shots in hopes his secondaries and command improve another year removed from surgery. He also has opportunity right out the gate.
PITCHERS — Davenport’s Dudes
Similar to the hitters, the Davenport pitcher projections tend to be kinder to less toolsy but more skilled players, i.e. guys with lower velocity, strikeout, and whiff rates.
Noah Cameron (270 ADP)
CD: 3.80 ERA, 1.18 WHIP, 110 K (128 IP)
FG Composite: 4.40 ERA, 1.33 WHIP, 123 K (147 IP)
Cameron’s best FG projection: 4.22, 1.30 (ATC). Funky lefty who will likely outrun his skill indicators.
—
Ranger Suarez (168 ADP)
CD: 3.24 ERA, 1.12 WHIP, 145 K (158.7 IP)
FG Composite: 3.84 ERA, 1.25 WHIP, 150 K (169 IP)
Maybe Davenport includes a special southpaw sauce. It’s fair to expect some pullback from last year’s 3.20 ERA—Suarez had a fortunate 8.8% HR/FB%—but it’s a sterling 3.38 for his career. Yet the best FG projection says 3.78 (The Bat).
—
Luis Castillo (162 ADP)
CD: 3.50 ERA, 1.14 WHIP, 159 K (177 IP)
FG Composite: 3.97 ERA, 1.21 WHIP, 166 K (179 IP)
Totally boring, serviceable veteran stabilizer. Strikeout rate keeps dipping but he pushed it to 23.5% in second half and control peaked, resulting in a 19.5% K-BB% post-ASG.
Song Of The Week
“Ohio” by CSN&Y is an obvious one that feels pertinent to the current moment. Will link it below…
“Blame” — Gabriels
Jacob Lusk, the extraordinary voice behind Gabriels, finished fifth on American Idol in 2011—in case we needed evidence that the greatest talent doesn’t always rise to the top of these competition shows.
Despite the exposure, five years passed before Lusk formed his band Gabriels, and another five before they released two EPs that drew some earbells (© Chris Harris of Harris Football), including Elton John’s.
Bloodlines, the second EP, resembles taking a rapid transit time machine—the four-song set lasts 15 minutes—through the work of Nina Simone to mid-century jook joints to smoky 1930s jazz bars. The entire record feels bracing and original but also familiar.
“Blame” is the haunting, dramatic standout. Musically it’s also a minor lift—or more likely, homage—to Simone’s “Take Care of Business.”
However, the entirely original and devastating moments hit in the refrain. The harmonic shift with the chord change at the lines beginning, “not a captive”—just brilliantly inventive and affecting. You just don’t hear chord choices like this often (/ever) in contemporary pop.
“Ohio” was written and recorded in the weeks following the Kent State University shooting in May 1970, when National Guardsmen opened fire into a crowd of unarmed college protestors, killing four and wounding nine others.